Performance
Accessibility Checker
System - Joomla Accessibility Checker
This is a core plugin that can be used to check accessibility whilst creating article content. The following screenshot shows some plugin settings:

With the Show Always option set to On the report icon appears on every page of the site. That is useful for development but should never be left on for a live site. Set it to Off!
With the Show Always option set to On each site page has an icon at the bottom right with a count of the number of issues. The following screenshot shows the icon selected to show a panel of information. It includes a Page Outline, Readability comments and Warnings, which can be selected one by one. The first issue has been selected.

The Articles: Edit form has an Accessibikity Check button in the Toolbar. It shows the check for an individual article in a popup window:

Fixing Problems
The Accessibility Checker is a tool to identify problems. It does not correct problems. That is up to you. The checker has some settings you can toggle On/Off as required. They include Contrast, Form Labels, Links (Advanced) AAA, Readability AAA, Dark Mode and Colour Filter with simulation of four types of faulty colour vision.
For more information see the Sa11y Overview
For example, on Readability, it says:
Sa11y can estimate the readability score from all paragraphs and list content. A good readability score is an indication that your writing is understandable and easy to digest. It is based on the average length of sentences and words on your page, using a formula known as the Flesch reading-ease test (Wikipedia). A "good" reading score is between 60 and 100. Sometimes it may be difficult to achieve a good readability score. Most of your pages may say "difficult". Remember that this feature is only used to estimate the readability of your content. It should only be used as a reference, and not an indication of conformance. Sa11y calculates the readability score based on all paragraph (
<p>tags) and list content (<li>tags). A low score does not affect the pass or fail state of Sa11y.
Managing 404 Errors
Why 404 Not Found Matters
The most common problem with websites which are struggling in search engine rankings is the number of 'not found' errors – commonly referred to as 404 errors because that is the status code returned if the page cannot be found.
First, there are legitimate reasons to have 404 errors – if you have a page for an event which has passed, or a service which you no longer provide. In these cases, eventually the page will be removed from the index of search engines and won't be associated with your site any more.
The problem occurs if you have a lot of 404 errors – for example if you unpublish a category which contained hundreds of articles. From the search engine's perspective, this is not a great experience for their visitors, because they land on your site and the information that the search engine told them was there, isn't. This is why it is not a great idea to have too many 404 errors on your site.
Google Search Central
The first step is to find out how many you have – which can be done using Google's Search Central. This is a free set of tools which allows you to analyse your website and pick up on problems, errors and issues quickly. It is recommended that you have every site you manage registered at Search Central to ensure you are notified in the event of any problems.
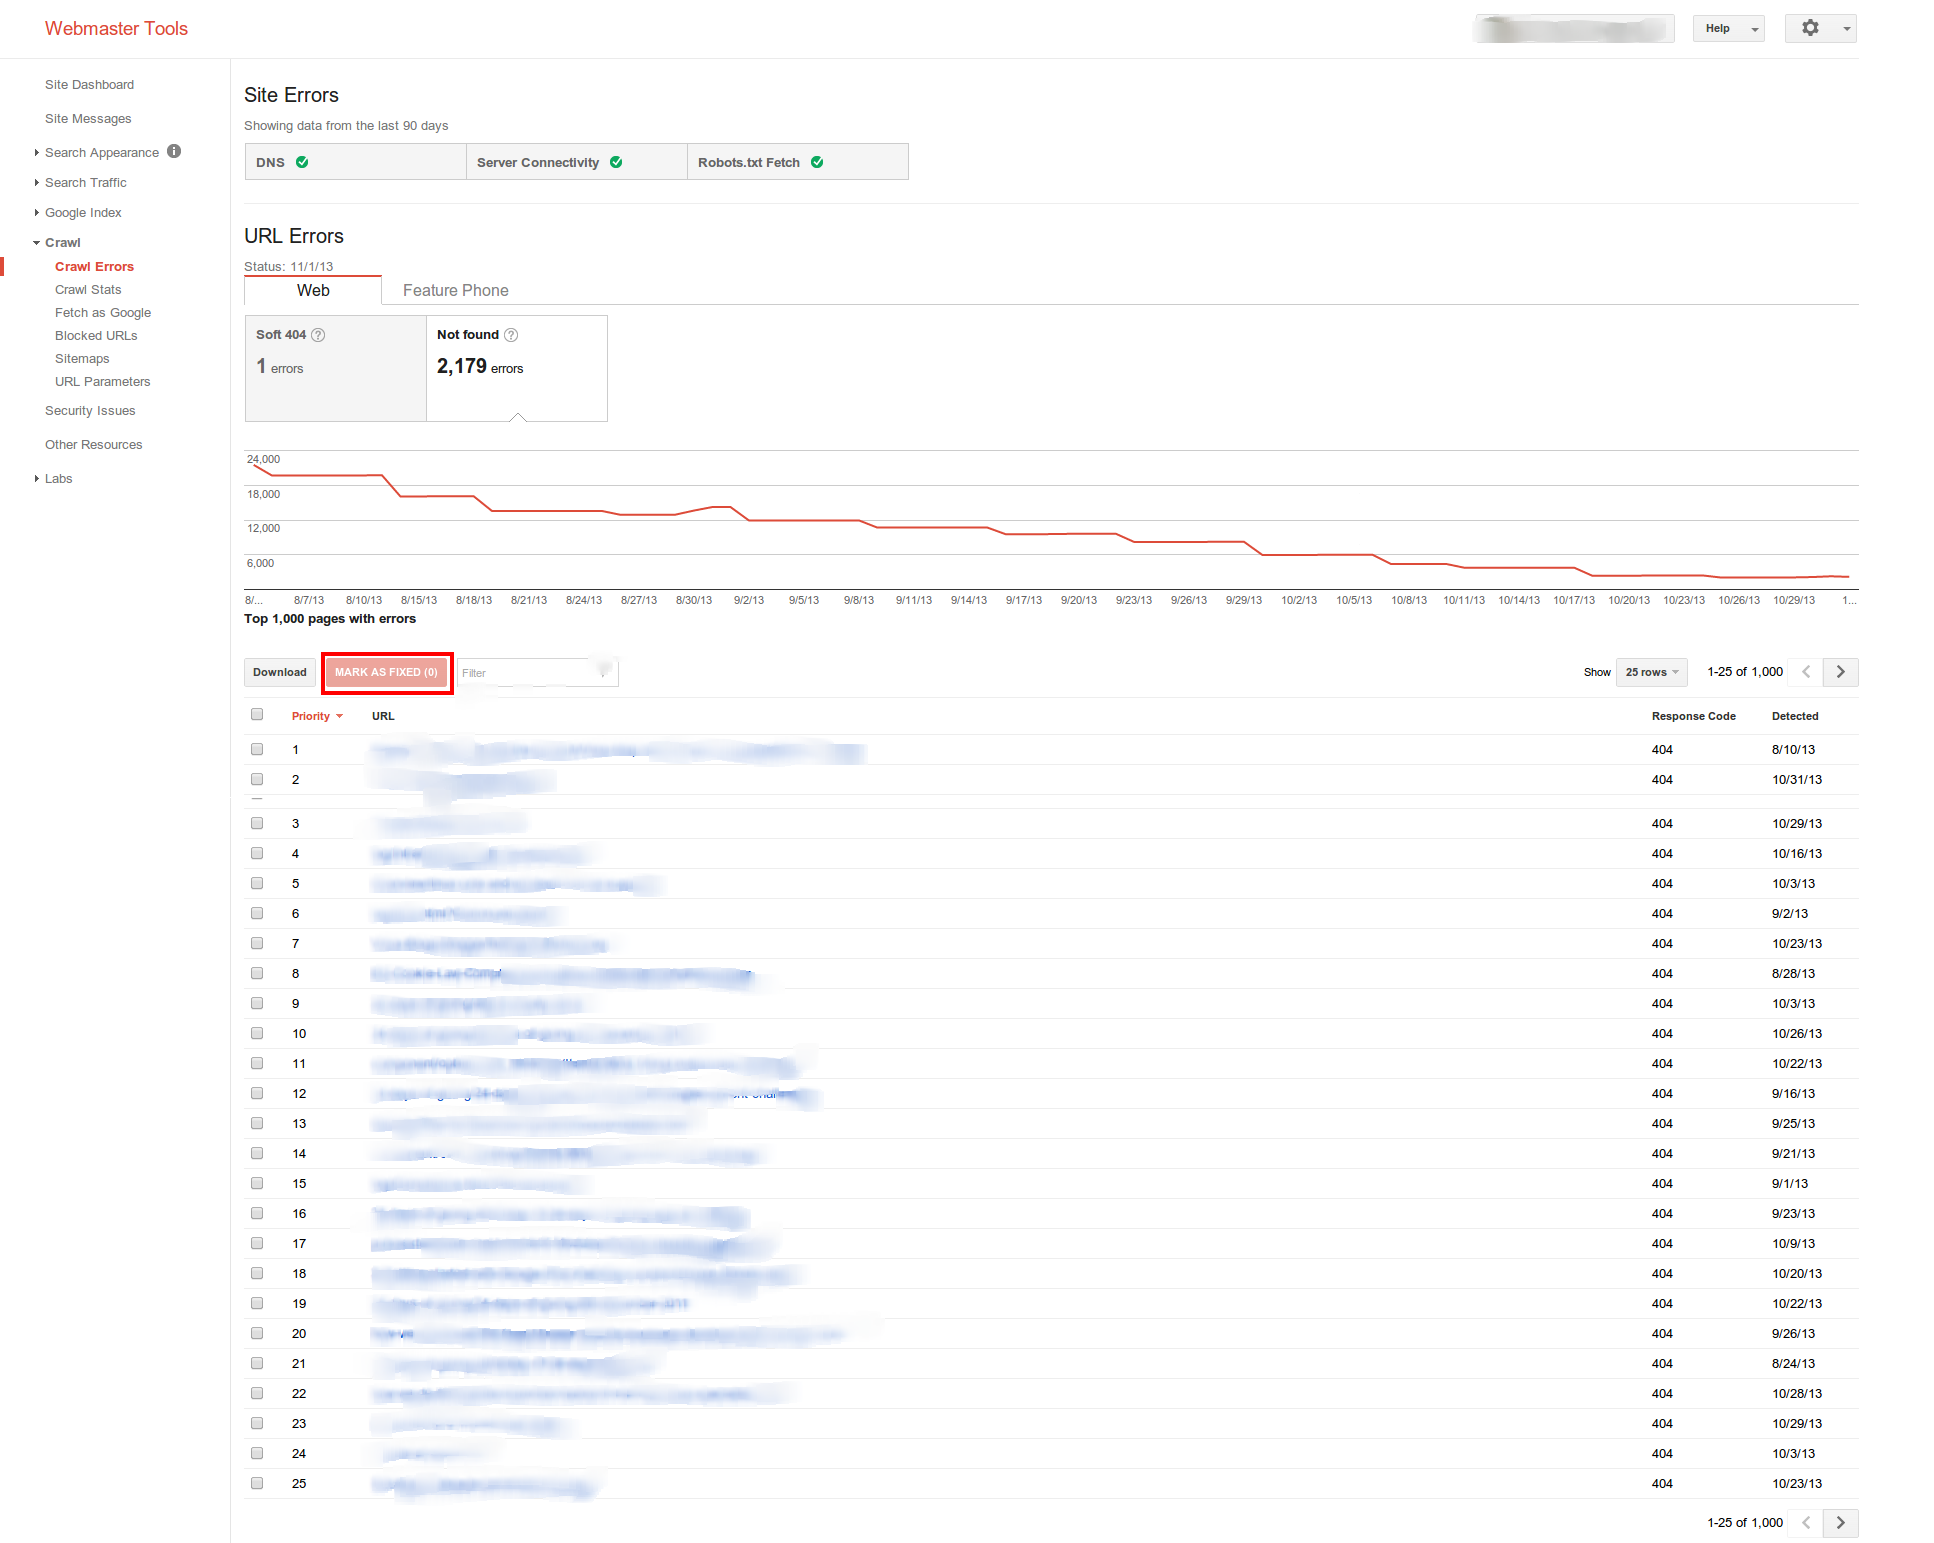
When you visit Search Central there is a section which shows you URL Errors in the search listing – this will show you a list of the 404 errors that Google has found on your site, and a graph which shows you how this has changed over time. If the graph starts to go up, look into why there are pages that were on your site and now can't be found.
If there was a temporary problem on your site, you can mark errors as being fixed.
Fixing Problems
Discovery is only one part of the process. Once you have discovered the problematic URLs, do something about it (if it needs fixing!) by either redirecting the page to another on the site, re-instating the original page, or looking into what has caused the 404 error.
If you need to redirect a page you can use the System - Redirect plugin to collect missing pages and the System / Redirects component to redirect missing pages to existing pages.
Monitoring Problems
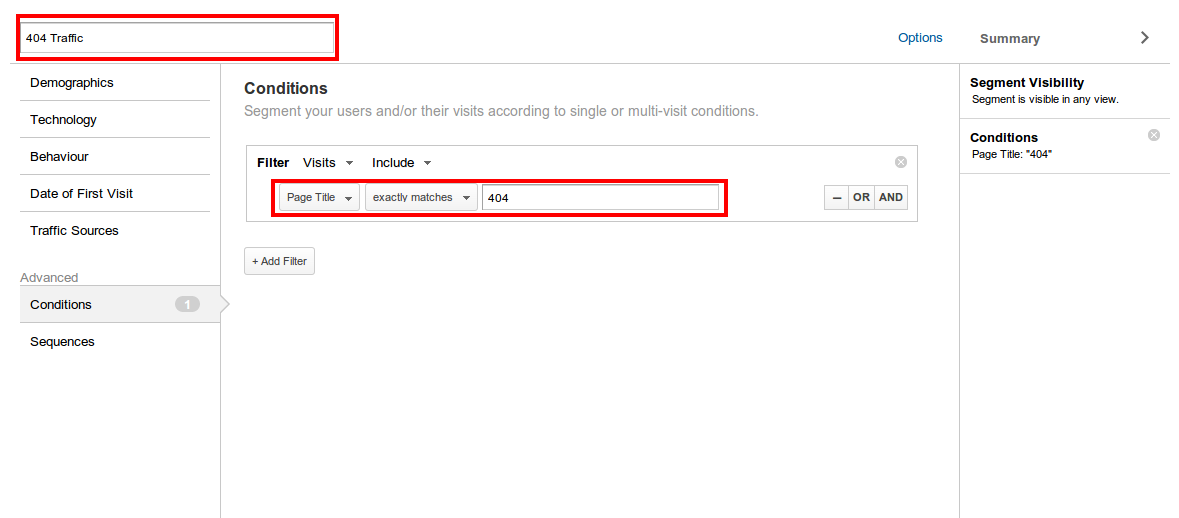
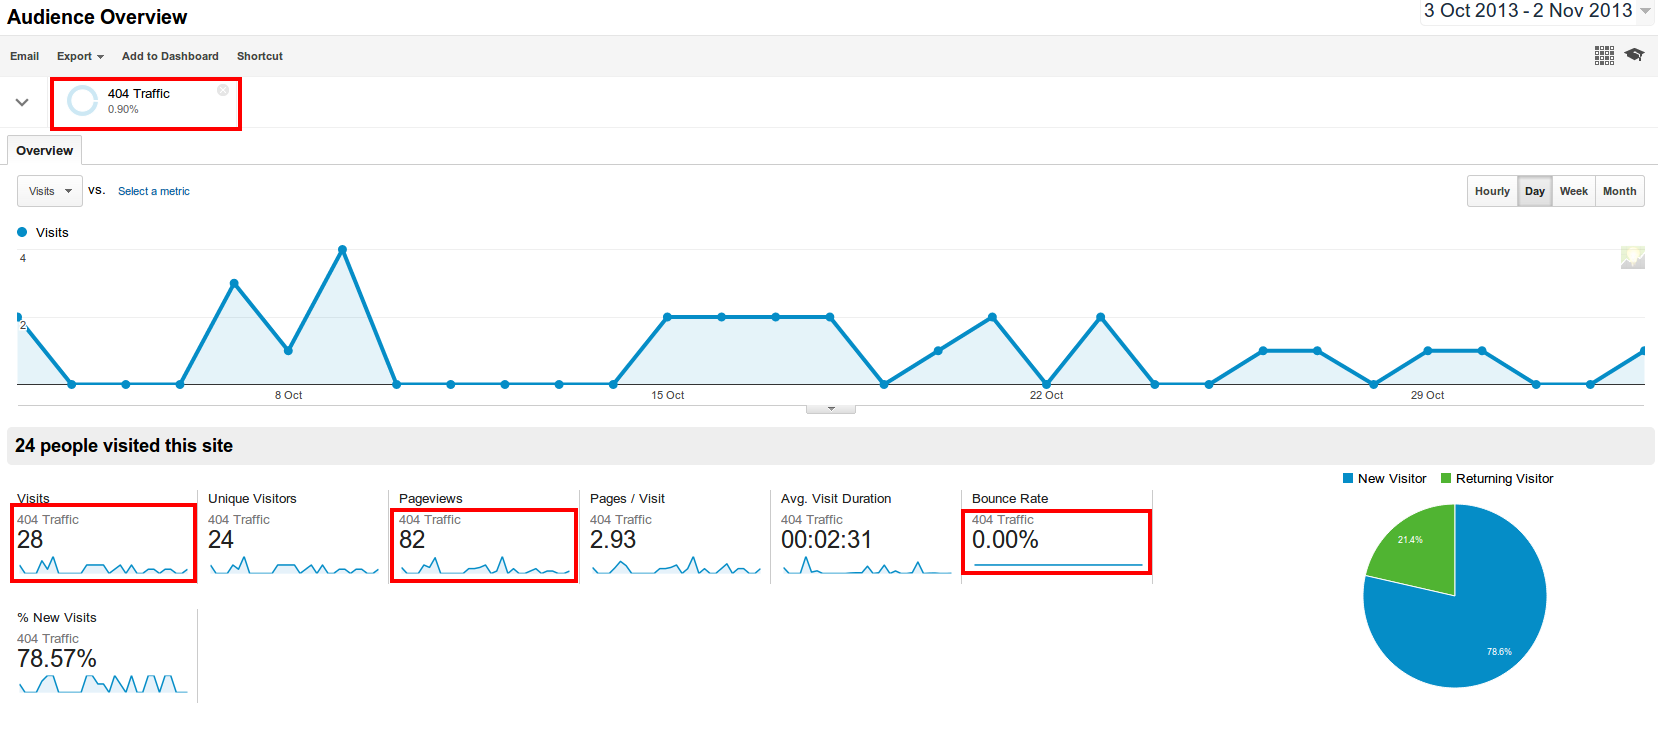
If you want to monitor your 404 traffic, the best way to do this in Analytics is to look at what happens when you have a 404 error. In most cases, the page title changes to 404 – so we can create a custom segment which will filter traffic with a title of 404 and tell you what the landing page is. This should allow you to monitor and proactively manage your 404 errors and ensure that your site visitors do not end up landing on dead links.
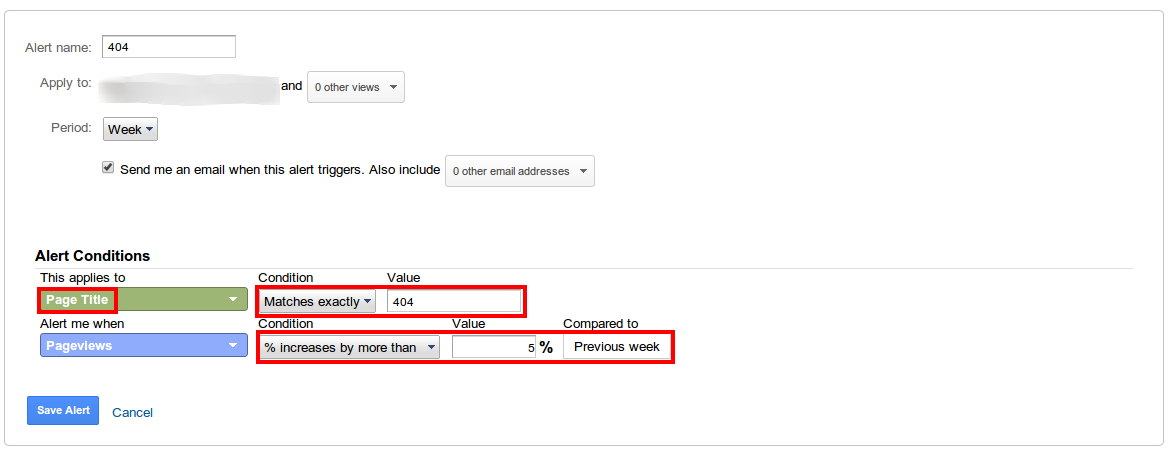
Google also has the ability, in Analytics, to set up alerts. Alerts allow you to be emailed when certain events occur. In this case, we can set up an alert to be notified if there is more than a 5% increase in the number of 404 errors in a weekly period – which might mean we have a problem with the website which needs investigating.
This is a great way to keep on top of things even if you haven't logged in to look at your dashboard!
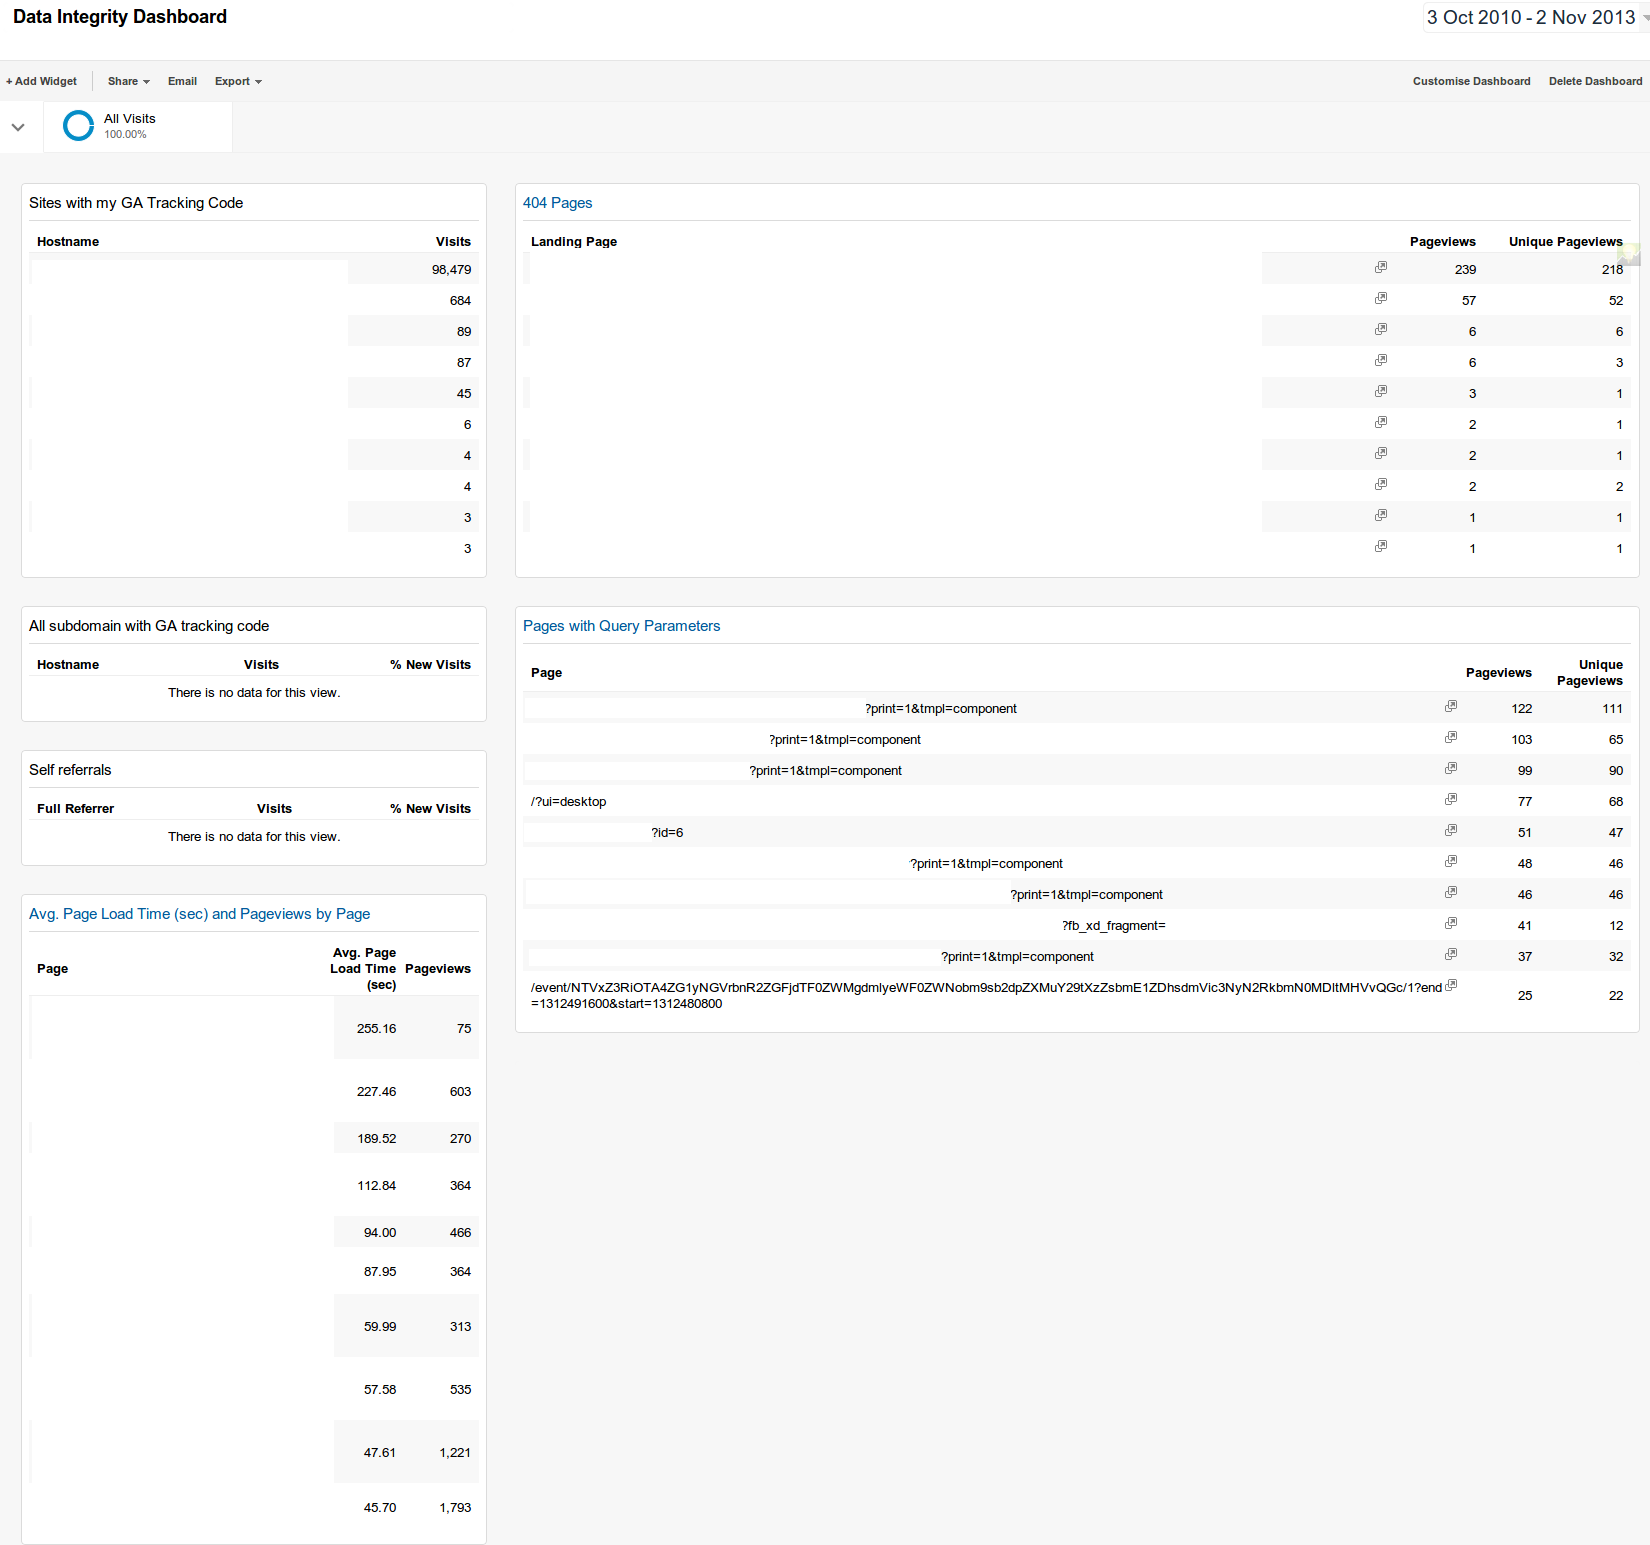
Monitoring Errors with a Dashboard
There is also a dashboard you can install called the Data Integrity Dashboard which shows you information about 404 errors, along with some other metrics which might be of interest. Just search the Google Analytics Gallery for Data Integrity Dashboard and select which profile to install it under.
Monitoring Server Health
Even if you have a fantastically optimised website, if the server that it is hosted on is not performing well, it will not load well for your visitors. Therefore it is recommended even if you are on shared hosting, that you use one of the many systems which allow you to track uptime, response time and ideally alert you in the event of problems. Pingdom has a free trial that does that for one site – ideal for keeping track of your site.
Monitoring Server Health in Google Analytics
You can also view the server response time in Google Analytics and track it over time. In this case we can see some significant increases in response time (which would translate as the sites on the server loading slowly) and also some significant improvements, which would result in a better loading time. If you look at the chart over time, you should be able to associate some of the lumps and bumps with things which have happened – such as in this case moving to a faster hosting environment, experiencing a Denial of Service attack, high load due to celebrity sharing a site hosted on the server, and reducing load as high-use clients are offloaded onto their own hosting servers.
It is also possible to view this data with a map overlay - showing you which countries have problems with page load times.
This kind of insight can be helpful in identifying developing problems, however you should enlist a server administrator if you are managing your own servers, who can manage this using a purpose-built system such as the open source Nagios package.
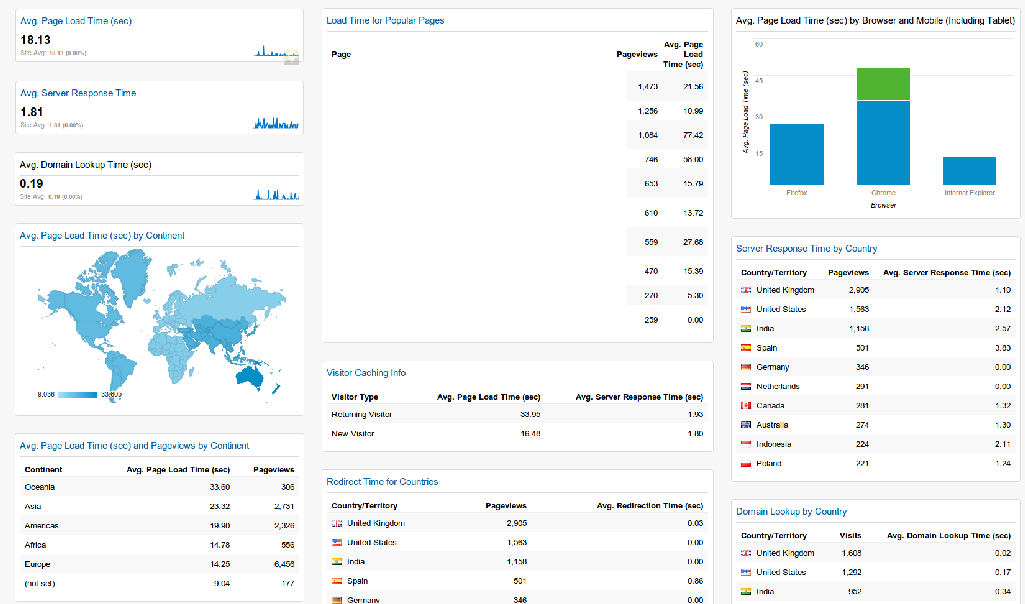
Site Performance Dashboard
Like the other metrics, there is also a pre-built Site Performance Dashboard which you can drop into your Analytics account giving you all the key information. You can also add widgets to these dashboards, and tweak them to show in the format you prefer. They aren't set in stone.
Monitoring Site Speed
The next problem that we commonly see has to do with site speed – the time it takes for your pages to load. There are several factors that affect the time it takes a page to load – not only to do with with page itself, but also the server it is hosted on and the location of the person visiting the site.
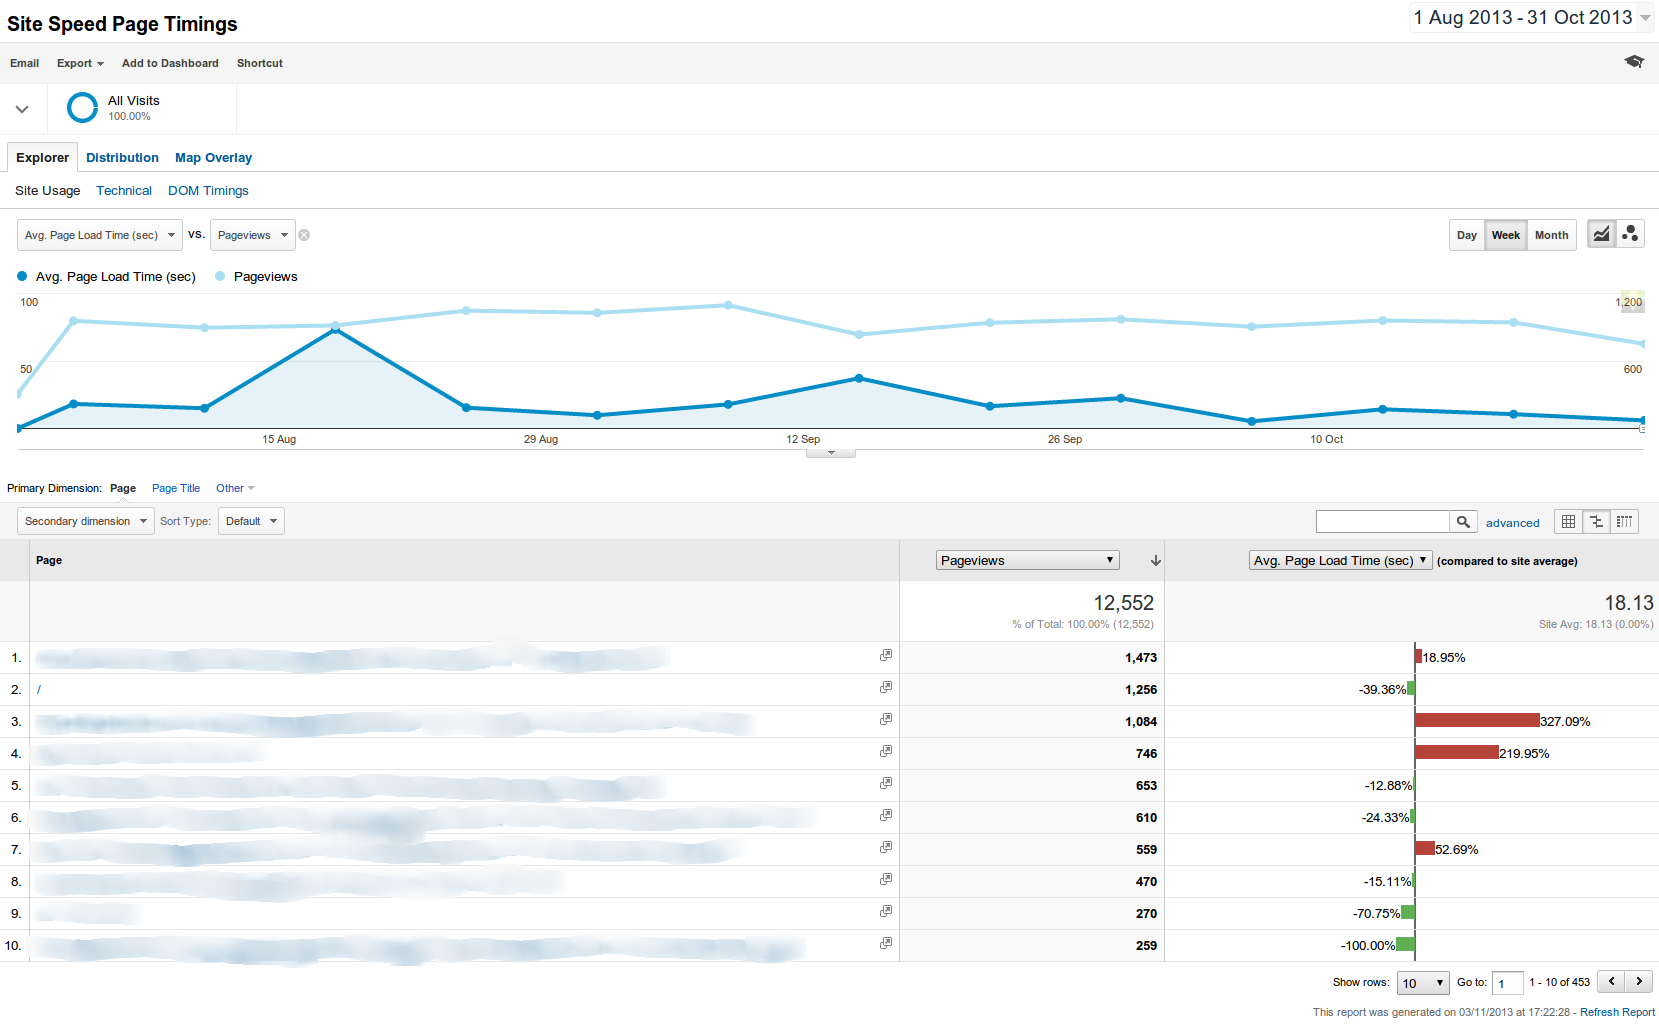
Analysing Site Performance
First, it's a good idea to have a look at how the site is performing – there is a view in Google Analytics called Site Speed Page Timings which allows you to view this information over time. You can also run tests using Pingdom Tools – with servers located around the world to find out how your site is performing at this moment. This is useful to get a before and after comparison when enabling caching, compression and so forth to see what kind of difference is being seen in the load time.
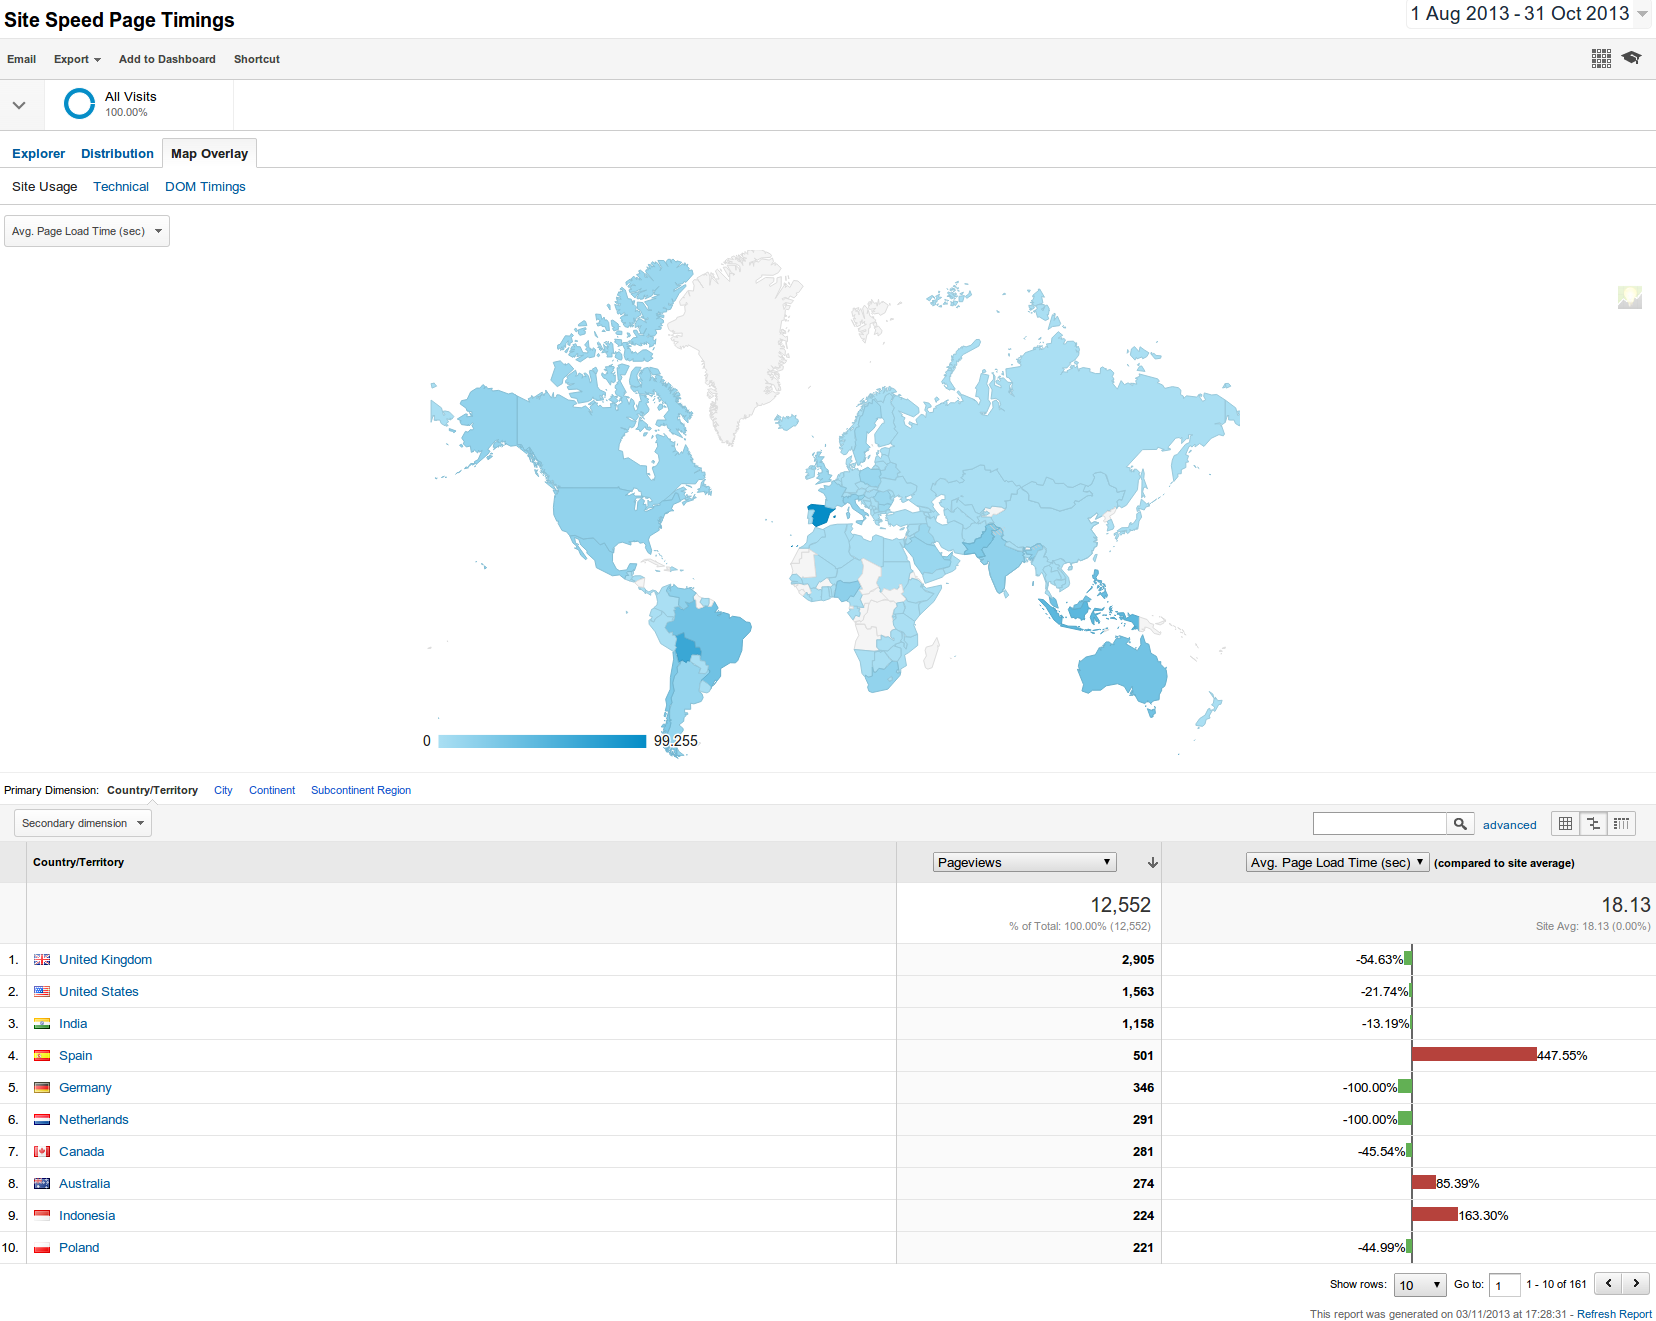
Monitoring Speed by Geographical Region
It may also be relevant to analyse the speed of your site by geographical region. When you are viewing the Site Speed Page Timings report, click on a tab at the top of the page to show the data on a map overlay. This shows you which countries are experiencing problems with site speed and can help you to put in place measures to improve this. You can see from this graph that there seemed to have been a problem with people visiting this site from Spain during the time period selected. If this continued to be a problem it would be important to investigate further – especially if that geographical region is important for your website.
Page Analysis
Lighthouse
Lighthouse is an open-source, automated tool for improving the quality of web pages. You can run it against any web page, public or requiring authentication. It has audits for performance, accessibility, progressive web apps, SEO, and more.
It is available as an add-on tool for Google Chrome and Firefox and it can be run from the command line. That is useful for testing on a local development environment.
More information from the Chrome for Developers: Lighthouse website.
You can use the tool online from the PageSpeed Insightsthis site.
The following screenshot shows the first part of the PageSpeed Insights report:

Performance Improvements
The second part of the report suggests methods to improve performance:
- Eliminate render-blocking resources - Potential savings of 540 ms. Frankly, this is too much work for too little reward.
- Enable text compression Potential saving of 11 KiB. In Global Configuration, Server panel, set GZip Page Compression to Yes. That leaves small JavaScript and CSS files yet to be minified and compressed.
- Reduce unused CSS Potential savings of 62 KiB. The culprits are template.min.css and joomla-fontawesome.min.css but that implies tayloring the CSS for each page in the site which is too much error prone work for too little reward.
- Serve static assets with an efficient cache policy - 21 resources found. References provided, including Joomla specific references.
The overal message is that some suggestions are worthwhile fixing and others are not.
Mobile vs Desktop Report
The Desktop report usually differs from the Mobile report. Some extra issues identified in this case:
- Properly size images - Potential savings of 48 KiB. The image tag is actually optimised with webp images at 768 and 1200 pixels wide. It seems that something in between is called for.
Accessibility
- Links do not have a discernable name This refers to the Left and Right arrows at the bottom of the page that navigate forward or backward. The text was left out to avoid translation problems. Need to think again!
- Touch targets do not have sufficient size or spacing This refers to the size of the menu items in the left and right columns. They need more vertical space - a CSS tweak is needed.
Best Practices and SEO
Although both scored 100 for Mobile and Desktop they need to be checked again after every design change.
Summary
All the problems in this site fixed except for dismantling the css files and minifiying the small component Javascript and CSS files.